

Are you worried about market crash ?
Please read below to find out how US long term treasuries can come to your rescue.

In this version of my write up, I will deviate from the norm of writing about equities and I will be sharing with the readers my further understanding of the asset class that has a negative correlation with equities and how we can leverage that asset class to our advantage in the time of adversity.
Without further suspension, I am talking about long term US treasuries. I have been studying US treasuries and yield curve for the last few months and I have finally come to the conclusion that they have a place in my portfolio.
Let us discuss the yield curve first.
Yield curve
The yield curve is the graph that shows yield on bonds of different duration issued by the US government. The bonds (debt) issued by the US government are considered to be the safest asset by the market because they are backed by full faith of the United States government and thus by US citizens.
The X axis represents the term or maturity duration while the y axis represents the percentage of yields.
The rule of the game in yield curve business is that yield on the short end of the curve is controlled by the Federal reserve’s Federal open market committee (FOMC) and long end in general is dictated by the market. But, the Fed has been intervening in the market buying bonds thus manipulating or influencing yields on the long end as well.

The graph above shows the yield curve on 7/7/2021.
The yield curve broadly comes in three different shapes:
Steep curve
Flat curve
Inverted curve
Steep Curve
When the curve is steep it looks somewhat like this:

Back in January 2021, when everyone including bond investors were expecting modest inflation, the curve appeared somewhat steep. When the yield curve is steep, the yield is higher as you move to the right of the curve. When bond investors expect modest inflation, growth and a roaring economy they demand higher yield for lending money for a longer period of time. The yield will be highest for 20 and 30 yr bonds and will be least for 1 month, 3 month or 6 months bills.
In conclusion, when the yield curve is steep, the bond investors expect growth and inflation. The degree of growth and inflation they are expecting will probably reflect on how much yield they are demanding on (20 yr and 30 yr) bonds and 10 year treasury.
Flat yield curve
As the economy heats up and the Federal reserve is expecting rising inflation, the Federal reserve starts raising the Federal fund rate which is the overnight lending rate for the banks. This rate affects the short end of the yield curve. At the same time, the bonds investors are already anticipating that the Fed will raise rates at the short end of the curve and also getting the signal from the fed and the general economy that there is no future inflation and growth. So, they don’t demand higher rates at the long end of the curve. This may lead to flattening of the curve. We have to understand that as the Federal Reserve starts raising rates at the short end, it is tightening monetary policy to apply brakes to the heated economy thus giving market signals that the growth and inflation will be lower in the future. This causes flattening of the yield curve.
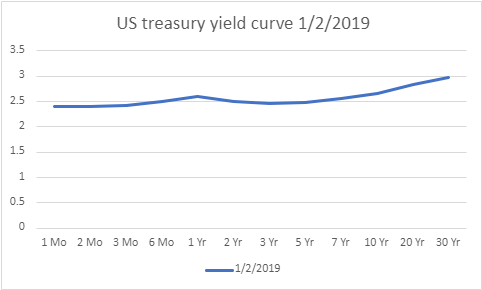
The yield curve had flattened in January 2019 when the Federal reserve was raising short term interest rates aggressively in the later part of 2018.
Inverted Yield curve
When the economy heats up and inflation is rising, the Federal reserve will continue raising rates aggressively until inflation is tamed. This also means that due to the Federal reserve's tight monetary policy, the economic activity will be slower. The bond investors will also expect the short term rates to fall. It is logical for the bond investors to buy more of long term treasuries and lock in the rate of higher yielding bonds. This causes an increase in demand for 20 yr and 30 yr bonds thus lowering the yields as prices of 20 yr and 30 yr treasury bonds go up. This leads to an inversion of the yield curve.
Last time this happened was before the 2008-2009 recession in 2006.

Now, let's come back to the topic of how we as a retail investor can use this knowledge to protect our portfolio.
One thing I want to make clear is that I am not an economist. I don’t have any formal degree or training in economy and bonds. This is just based purely on my own due diligence. Please take it for what it is worth.
During my research I found out that 20 yr and 30 yr treasury bonds are the ultimate safe haven asset. They always rise when there is a severe stock market crash.
Following charts from 2009, and 2020 will demonstrate what I am intending to. As the saying goes, pictures are worth a thousand words.
I am using $TLT which is an ETF of 20 yr and 30 yr treasury bonds as an example and comparing it with $SPY during the September 2008 market crash!

As you can see, $TLT has a negative correlation with $SPY during the market crash. I found this to be my safe haven.
Let me use another example during the recent market crash of 2020 during COVID 19 pandemic. See below:

Again $TLT behaves in a similar way. It goes up when $SPY crashes, suggesting that it is ultimate flight to safety.
So, moving forward I am going to use long term US treasury bonds in my portfolio.
I will use them as equivalent to cash position.
It is comforting that when $SPY corrects or the market crashes the value of $TLT or $EDV appreciates significantly.
I will sell $TLT or $EDV during market crashes to buy depressed equities at a steeper discount. Instead of just sitting in cash, it is useful to own an asset that appreciates during bad times.
Monitor closely what is happening at the yield curve to anticipate what bond investors are thinking. Bond investors are more sophisticated investors than equity investors. Usually they are right about the state of economy than anyone else!
The changes in the yield curve affect the equity market but not vice versa.
I hope you enjoyed my blog. If you really liked it, please don’t hesitate to share, like or leave comments below.
Hi Anil, Checkout the Hedgefundie portfolio - 3X leveraged UPRO and TMF in 55%/45% ratio which builds on the same idea - in case of a crash, the TMF hedges the UPRO. There is data to suggest that this results in a CAGR of 35% over the since 1990 when leveraged ETFs came into being.
Learned so much from this. Thanks Anil. what do you personally use to monitor the yield curve? A link would help.